What Are Technical Indicators?
advertisement
In technical analysis, indicators are used to predict the direction of the market. They are mathematical calculations based on historical prices, trading volumes, or a combination of the two. Indicators are an integral part of technical analysis. Indicators are often back-tested against historical price and volume data to test their effectiveness in predicting future market direction. Technical indicators can be roughly divided into four categories:
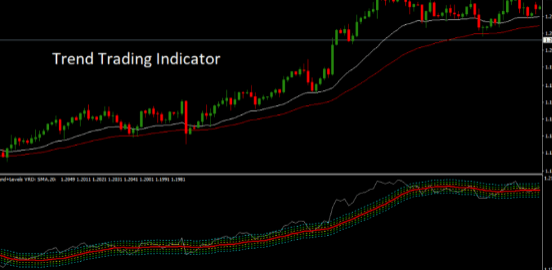
Trend Indicators – A trend is the general direction of an asset’s price movement. Trend indicators are used to identify market trends and identify potential "buy" and "sell" areas. Simple Moving Average (SMA) and Exponential Moving Average (EMA) are two of the most commonly used trend indicators.
Momentum Indicators – Momentum indicators measure how quickly an asset’s price changes. Widely used momentum indicators include the Stochastic Oscillator, the Relative Strength Index (RSI), and William's %R.
Volume Indicators – The volume indicator is used to confirm the strength of price action. Movements that are not confirmed by volume often lead to price reversals. The most popular volume indicators include On Balance Volume (OBV), Accumulation Distribution, and Money Flow Index (MFI).
Volatility Indicators – Volatility indicators measure price movements of an asset. Periods of high market volatility are often followed by periods of low volatility, and vice versa. Bollinger Bands, Average True Range (ATR), and Keltner Channels are examples of commonly used volatility indicators.
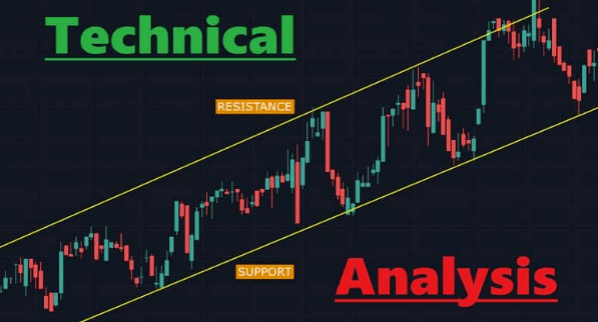
Technical indicators provide traders with a realistic decision-making framework. Indicators represent a more mathematical approach to analysis rather than buying and selling based on intuition and hearsay. By looking at price trend, momentum, volume, and volatility, traders can gain more information about how prices are changing, which in turn forms the basis for opening and closing positions. The ultimate purpose of technical indicators is to identify potential "buy" and "sell" positions on a price chart. For example, a crossover between two simple moving averages often accompanies a trend change, which is one of the most basic technical trading signals. By adding a moving average to a price chart, traders can spot areas where the trend may change direction.
An advanced form of technical analysis uses "strategies" to determine buying and selling rules. A technical trading strategy is a set of rules that define how positions are opened and closed. Typically, a strategy involves the specific use of one or more indicators, focusing on areas with a higher probability of achieving a successful trading outcome. A major advantage of using indicator-based strategies for trading and investing is that these techniques help reduce the chances of our emotions influencing the decision-making process.
The most common mistake beginners make when using indicators is using too many indicators to generate "buy" and "sell" signals. "More is better" may apply in other areas of life, but this rule does not necessarily apply to trading. Too many indicators can lead to "analytical incompetence". Research has shown that limiting the number of indicators to 5 can help optimize trading results. Another common mistake beginners make is to use multiple indicators that also focus on the characteristics of price change, such as momentum. This can lead to redundant signals. Ideally, traders should choose indicators that balance each other well, rather than providing redundant results. For example, a useful strategy might include trend indicators and momentum indicators to generate position-opening signals.
(Writer:Warry)
Related Articles